| Paper | A phase I clinical, plasma, and cellular pharmacology study of gemcitabine |
| Authors | Abbruzzese J.L., Grunewald R., Weeks E.A., Gravel D., Adams T., Nowak B., Mineishi S., Tarassoff P., Satterlee W., Raber M.N., et al. |
| Publication | Journal of Clinical Oncology Mar 1, 1991:491–8 |
| Links | [Abstract] [PDF] |
Key Points for Patients
- This study set the MTD for subsequent patient studies at 790 mg/m2/wk on days 1, 8, and 15 of a 28-day cycle
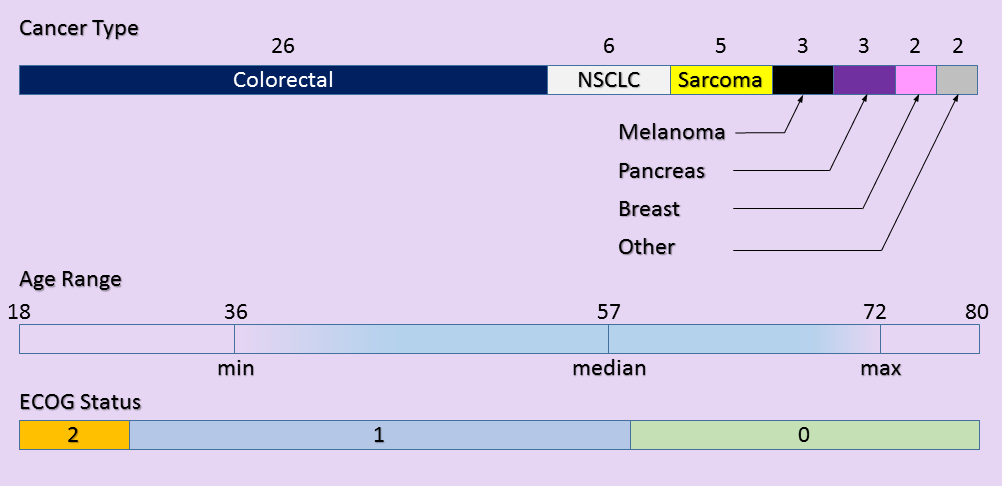
- Patients with a variety of cancers were enrolled (3 of 47 pancreatic adenocarcinoma)
- Treatment efficacy was not a factor in determining MTD
- Current MTD for pancreatic adenocarcinoma is 1000 mg/m2/wk on days 1, 8, and 15 of a 28-day cycle
- Previous studies indicated that schedule was more important than dose dependence
- Early participants in the phase 1 study received very low doses, likely with no therapeutic effect
Overview
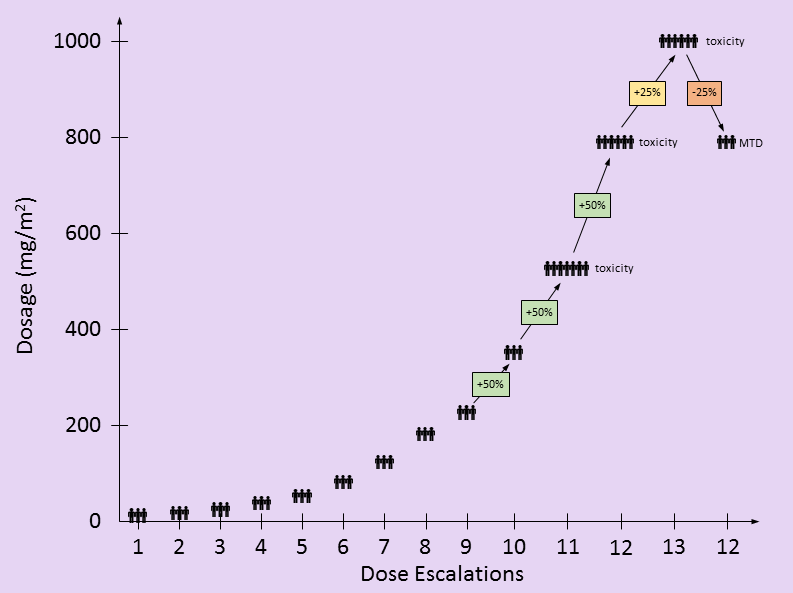
This gemcitabine dose escalation study treated 47 patients with various types of cancer and prior treatments into a traditional 3×3 study design [1]. At least three patients who’d never had gemcitabine received each dosage level and were evaluated for toxicities before testing proceeded to the next dosing level. Once a dosage level had too many toxicity events, the dosage was reduced, adding more patients to verify safety. The maximum-tolerated dose (MTD) was determined by unacceptable toxicity measures alone. Therefore, the types of cancers and patient responses were not important in determining the recommended MTD.
Dosing
Patients in this gemcitabine dose escalation study received the gemcitabine chemotherapy over a 30 minute interval on days 1, 8, and 15 of a 28 day cycle, the same infusion schedule and rate recommended today. Additional studies have been performed for different infusion schedules, doses, and rates – all of which affect the toxicity profile [2]. When making gemcitabine toxicity comparisons, infusion schedules, doses and rates need to be matched.
in the following table, I attempt to recreate the dosing used by this study based on the information provided in the paper. There are only two partial responses (PR), both occurring at doses lower than the eventual MTD. These PR’s were not factors in setting the MTD. The toxic events at higher dosing levels were factors in determining the MTD.
| Dose | N | PR | Toxic Events | |||||
| Neutropenia | Thrombocytopenia | Anemia | ||||||
| Grade 3 | Grade 4 | Grade 3 | Grade 4 | Grade 3/4 | ||||
| 1 | 10 mg/m² | 3 | 0 | 0 | 0 | 0 | 0 | 0 |
| 2 | 15 mg/m² | 3 | 0 | 0 | 0 | 0 | 0 | 0 |
| 3 | 22.5 mg/m² | 3 | 0 | 0 | 0 | 0 | 0 | 0 |
| 4 | 35 mg/m² | 3 | 0 | 0 | 0 | 0 | 0 | 0 |
| 5 | 53 mg/m² | 3 | 0 | 0 | 0 | 0 | 0 | 0 |
| 6 | 80 mg/m² | 3 | 0 | 0 | 0 | 0 | 0 | 0 |
| 7 | 120 mg/m² | 3 | 0 | 0 | 0 | 0 | 0 | 0 |
| 8 | 180 mg/m² | 3 | 1 | 0 | 0 | 0 | 0 | 0 |
| 9 | 225 mg/m² | 3 | 0 | 0 | 0 | 0 | 0 | 0 |
| 10 | 350 mg/m² | 3 | 0 | 0 | 0 | 0 | 0 | 0 |
| 11 | 525 mg/m² | ≥7 | 1 | 0 | 0 | 1 | 0 | 1 |
| 12 | 790 mg/m² | ≥6 | 0 | ≈2 | 0 | ≈1 | ≈1 | ≈1 |
| 13 | 1000 mg/m² | ≥6 | 0 | 2 | 0 | 3 | 0 | 3 |
| 12 | 790 mg/m² | ≥3 | 0 | ≈1 | 0 | ≈2 | ≈0 | ≈1 |
Patients
A total of 47 patients participated in this study with characteristics shown below. All were assessed for toxicity. Only 28 patients were able to be assessed for disease response.
Tests
Blood and urine tests were performed to measure the concentrations of gemcitabine (dFdC) and subsequent byproducts (dFdU and dFdCTP) remaining in the blood and cells over time. Measurements of dFdCTP were from inside monocytes and lymphocytes (two white blood cell types) and used a proxy for tumor cell concentrations.
| Patients | Type | Description |
|---|---|---|
| 28 | Blood | Measure dFdC & dFdU concentrations over time |
| 26 | Blood | Measure dFdCTP concentration in monocytes and lymphocytes over time |
| 8 | Urine | Measure dFdC & dFdU concentrations over time |
Results
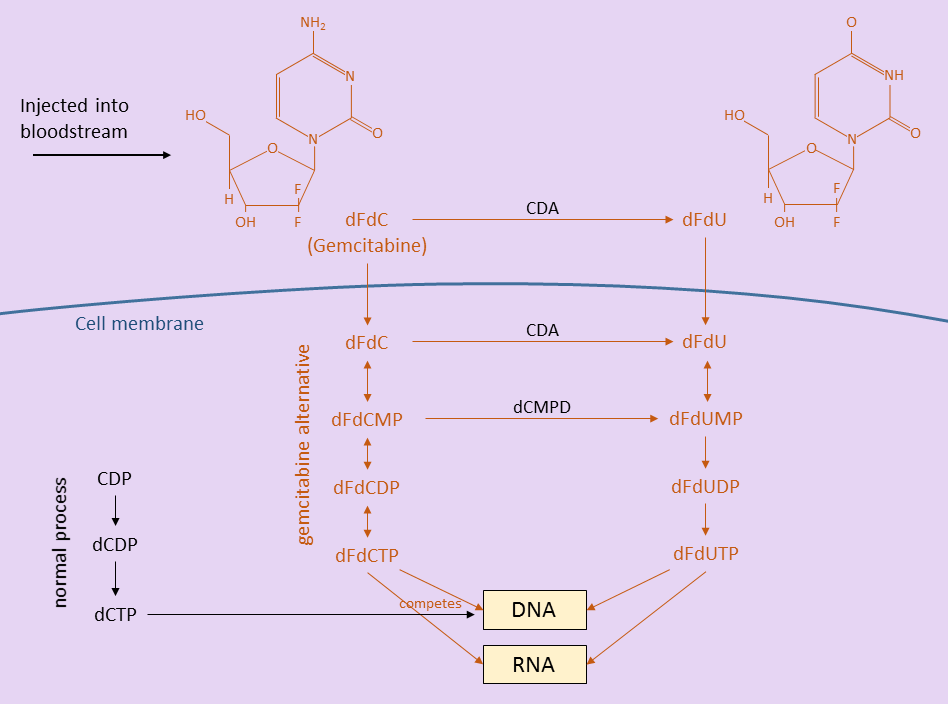
Before discussing the gemcitabine dose escalation study results, it is helpful to know a little about how gemcitabine works inside the patient. The figure below shows how gemcitabine (dFdC), after being injected into the body, breaks down into other molecules before being incorporated into DNA and disrupting the cell replication process [3]. The gemcitabine and its breakdown products are drawn in red.
Outside the cells, in the bloodstream, some gemcitabine is converted to dFdU. Some gemcitabine and dFdU enter cells (all cells – tumor and healthy) through the cell membrane. Still other gemcitabine and dFdU are filtered out and eliminated in urine.
Inside the cells, more gemcitabine is converted to dFdU. Gemcitabine is also eventually converted to dFdCTP, a product that competes with dCTP in helping to replicate DNA during cell division. In the normal cell division process, dCTP is used to replicate DNA. However, when dFdCTP is present (because of a gemcitabine infusion), it is sometimes substituted for dCTP. When dFdCTP is used instead, the cell replication process is disrupted and cannot continue. Rapidly dividing cells are most affected – tumors, blood cells, skin cells, intestinal lining, etc.
Toxicity
Dosage levels started at 10 mg/m2/wk with three new patients. Dosages escalated by 50% whenever no patients showed signs of toxicity. [I found it interesting that the dosages still escalated by 50% after 525 mg/m2/wk when there was an incidence of both thrombocytopenia and anemia – DD]. At 790 mg/m2/wk, additional events of thrombocytopenia and anemia as well as neutropenia were seen.
Pharmacology
Bloodstream
Gemcitabine and dFdU concentrations were measured in patients’ blood (directly) and urine samples (after being filtered through kidneys). Concentrations of gemcitabine in the blood peaked at 15 minutes after infusion and dissipated rapidly. The product dFdU remained in the blood much longer (median 14 hours) and its concentration was mostly independent of the gemcitabine dose given.
Intracellular
Monocyte and lymphocyte white blood cells were extracted from patient blood samples and the levels of dFdCTP were measured over time. The authors note that at doses of 350 mg/m2/wk and higher, the concentrations of dFdCTP did not increase [implies that doses higher than 350 mg/m2/wk did not increase chances of dFdCTP disrupting the cell division process? – DD].
Urine
dFdU was the major component present in urine. Half the dFdU was eliminated in the first 6 hours and 3/4 by 24 hours after infusion. The parent product gemcitabine was a minor component of urine and was totally eliminated within 6 hours.
Discrepancies
Here I’ll note a few discrepancies between the gemcitabine dose escalation study paper and my interpretation.
- The paper says: “Twelve dose escalations were required to define the MTD”. This may be an issue of semantics, but by my count, there were 13 total dose escalations, but the MTD was set at the 12th dosage level.
- My count of patients in the patient dosage table may be off slightly. Not all numbers are specified in the paper individually and I backed out these numbers from totals. I indicated uncertainty in numbers by using the tilde character.
- In Table 2 of the paper, the dosage level of 690 mg/m2/wk is listed. Based on a 50% escalation from the previous dosage level, I believe this is a typo and should be 790 mg/m2/wk. 790 mg/m2/wk is the value used elsewhere throughout the paper.


Its the first time I have ever seen how Gemcitabine works. Well done.