Gemcitabine Dose Escalation Study – a Paper Review

PaperA phase I clinical, plasma, and cellular pharmacology study of gemcitabine
AuthorsAbbruzzese J.L., Grunewald R., Weeks E.A., Gravel D., Adams T., Nowak B., Mineishi S., Tarassoff P., Satterlee W., Raber M.N., et al.
PublicationJournal of Clinical Oncology Mar 1, 1991:491–8
Links[Abstract] [PDF]

Key Points for Patients

  • This study set the MTD for subsequent patient studies at 790 mg/m2/wk on days 1, 8, and 15 of a 28-day cycle
  • Patients with a variety of cancers were enrolled (3 of 47 pancreatic adenocarcinoma)
  • Treatment efficacy was not a factor in determining MTD
  • Current MTD for pancreatic adenocarcinoma is 1000 mg/m2/wk on days 1, 8, and 15 of a 28-day cycle
  • Previous studies indicated that schedule was more important than dose dependence
  • Early participants in the phase 1 study received very low doses, likely with no therapeutic effect

Overview

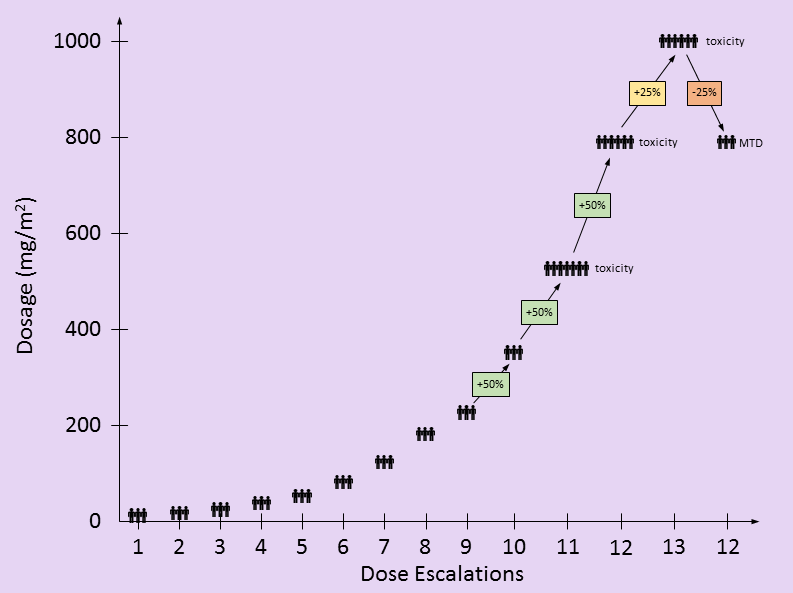
This gemcitabine dose escalation study treated 47 patients with various types of cancer and prior treatments into a traditional 3×3 study design [1]. At least three patients who’d never had gemcitabine received each dosage level and were evaluated for toxicities before testing proceeded to the next dosing level. Once a dosage level had too many toxicity events, the dosage was reduced, adding more patients to verify safety. The maximum-tolerated dose (MTD) was determined by unacceptable toxicity measures alone. Therefore, the types of cancers and patient responses were not important in determining the recommended MTD.

Gemcitabine Dose Escalation Study using Traditional 3x3 Design

Gemcitabine Dose Escalation using Traditional 3×3 Study Design

Dosing

Patients in this gemcitabine dose escalation study received the gemcitabine chemotherapy over a 30 minute interval on days 1, 8, and 15 of a 28 day cycle, the same infusion schedule and rate recommended today. Additional studies have been performed for different infusion schedules, doses, and rates – all of which affect the toxicity profile [2]. When making gemcitabine toxicity comparisons, infusion schedules, doses and rates need to be matched.

in the following table, I attempt to recreate the dosing used by this study based on the information provided in the paper. There are only two partial responses (PR), both occurring at doses lower than the eventual MTD. These PR’s were not factors in setting the MTD. The toxic events at higher dosing levels were factors in determining the MTD.

DoseNPRToxic Events
NeutropeniaThrombocytopeniaAnemia
Grade 3Grade 4Grade 3Grade 4Grade 3/4
110 mg/m²3000000
215 mg/m²3000000
322.5 mg/m²3000000
435 mg/m²3000000
553 mg/m²3000000
680 mg/m²3000000
7120 mg/m²3000000
8180 mg/m²3100000
9225 mg/m²3000000
10350 mg/m²3000000
11525 mg/m²≥7100101
12790 mg/m²≥60≈20≈1≈1≈1
131000 mg/m²≥6020303
12790 mg/m²≥30≈10≈2≈0≈1

Patients

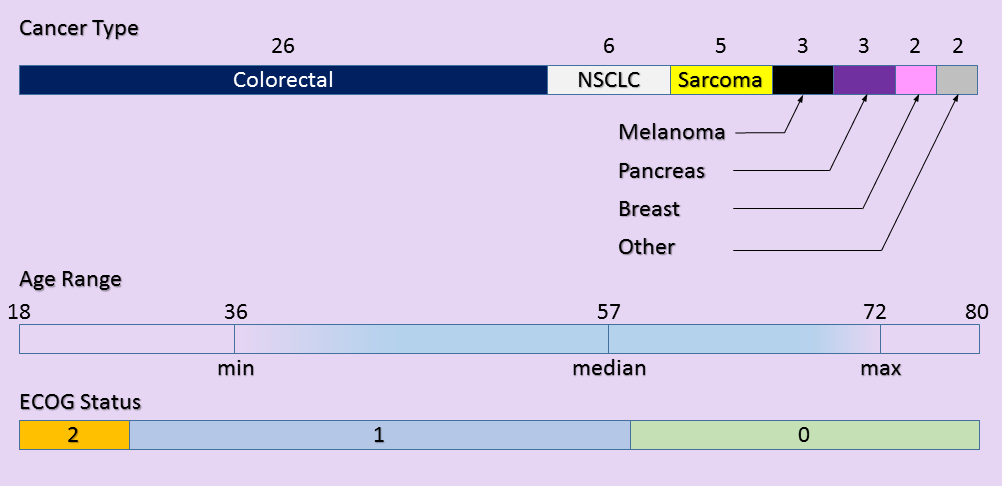
A total of 47 patients participated in this study with characteristics shown below. All were assessed for toxicity. Only 28 patients were able to be assessed for disease response.

Patient Demographics for Gemcitabine Dose Escalation Study

Patient Demographics

Tests

Blood and urine tests were performed to measure the concentrations of gemcitabine (dFdC) and subsequent byproducts (dFdU and dFdCTP) remaining in the blood and cells over time. Measurements of dFdCTP were from inside monocytes and lymphocytes (two white blood cell types) and used a proxy for tumor cell concentrations.

PatientsTypeDescription
28BloodMeasure dFdC & dFdU concentrations over time
26BloodMeasure dFdCTP concentration in monocytes and lymphocytes over time
8UrineMeasure dFdC & dFdU concentrations over time

Results

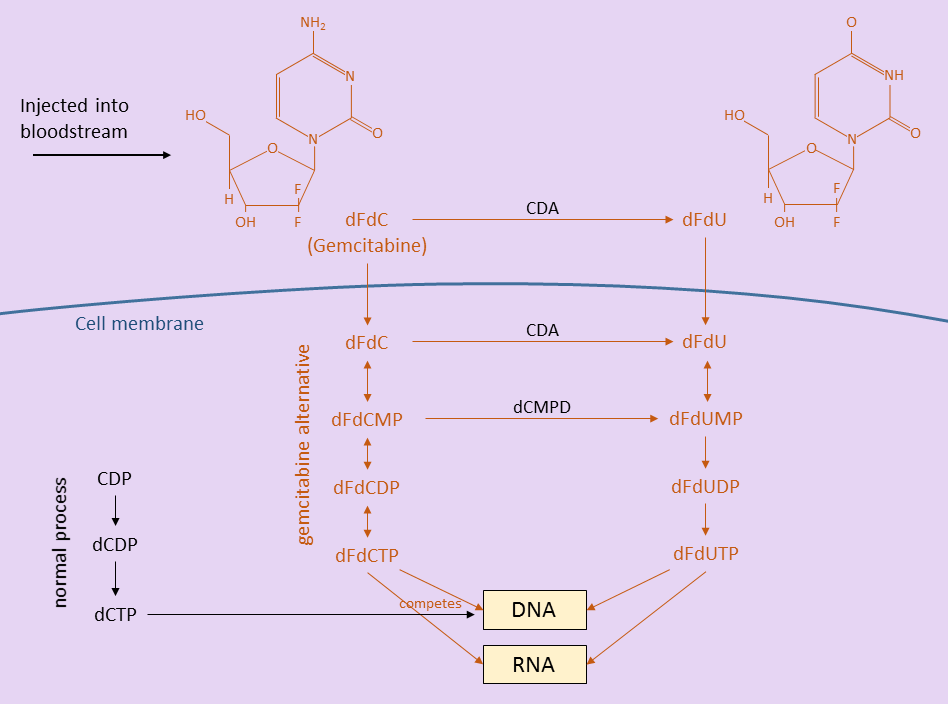
Before discussing the gemcitabine dose escalation study results, it is helpful to know a little about how gemcitabine works inside the patient. The figure below shows how gemcitabine (dFdC), after being injected into the body, breaks down into other molecules before being incorporated into DNA and disrupting the cell replication process [3]. The gemcitabine and its breakdown products are drawn in red.

Outside the cells, in the bloodstream, some gemcitabine is converted to dFdU. Some gemcitabine and dFdU enter cells (all cells – tumor and healthy) through the cell membrane. Still other gemcitabine and dFdU are filtered out and eliminated in urine.

Inside the cells, more gemcitabine is converted to dFdU. Gemcitabine is also eventually converted to dFdCTP, a product that competes with dCTP in helping to replicate DNA during cell division. In the normal cell division process, dCTP is used to replicate DNA. However, when dFdCTP is present (because of a gemcitabine infusion), it is sometimes substituted for dCTP. When dFdCTP is used instead, the cell replication process is disrupted and cannot continue. Rapidly dividing cells are most affected – tumors, blood cells, skin cells, intestinal lining, etc.

Breakdown of Gemcitabine in the Body

Breakdown of Gemcitabine in the Body

Toxicity

Dosage levels started at 10 mg/m2/wk with three new patients. Dosages escalated by 50% whenever no patients showed signs of toxicity. [I found it interesting that the dosages still escalated by 50% after 525 mg/m2/wk when there was an incidence of both thrombocytopenia and anemia – DD]. At 790 mg/m2/wk, additional events of thrombocytopenia and anemia as well as neutropenia were seen.

Pharmacology

Bloodstream

Gemcitabine and dFdU concentrations were measured in patients’ blood (directly) and urine samples (after being filtered through kidneys). Concentrations of gemcitabine in the blood peaked at 15 minutes after infusion and dissipated rapidly. The product dFdU remained in the blood much longer (median 14 hours) and its concentration was mostly independent of the gemcitabine dose given.

Intracellular

Monocyte and lymphocyte white blood cells were extracted from patient blood samples and the levels of dFdCTP were measured over time. The authors note that at doses of 350 mg/m2/wk and higher, the concentrations of dFdCTP did not increase [implies that doses higher than 350 mg/m2/wk did not increase chances of dFdCTP disrupting the cell division process? – DD].

Urine

dFdU was the major component present in urine. Half the dFdU was eliminated in the first 6 hours and 3/4 by 24 hours after infusion. The parent product gemcitabine was a minor component of urine and was totally eliminated within 6 hours.

Discrepancies

Here I’ll note a few discrepancies between the gemcitabine dose escalation study paper and my interpretation.

  • The paper says: “Twelve dose escalations were required to define the MTD”. This may be an issue of semantics, but by my count, there were 13 total dose escalations, but the MTD was set at the 12th dosage level.
  • My count of patients in the patient dosage table may be off slightly. Not all numbers are specified in the paper individually and I backed out these numbers from totals. I indicated uncertainty in numbers by using the tilde character.
  • In Table 2 of the paper, the dosage level of 690 mg/m2/wk is listed. Based on a 50% escalation from the previous dosage level, I believe this is a typo and should be 790 mg/m2/wk. 790 mg/m2/wk is the value used elsewhere throughout the paper.

Stockdale Paradox & Cancer

I’ve been thinking about how we patients and caregivers approach our struggle with cancer. I’m four years after diagnosis and in my second year of remission and I realize that I’m still not done. This will be a long-term struggle. Even in my enviable position, I still have periodic scans, receive an experimental vaccine, research new treatment options, and participate in online discussion groups. At any time, I can be thrown back into the treatment phase.

I’m not done with cancer and cancer’s not done with me.

We’re told to “beat cancer”, “make cancer history”, and become a “survivor”. But as I look forward from here, I don’t see any of these happening soon. I don’t see a real and lasting conclusion that doesn’t end in my death. Which is not to say that cancer wins!

This has led me to wondering what I can learn from patients with chronic diseases such as depression, diabetes, heart disease, HIV, etc? What mental attitude do they adopt that lets them endure over the long haul? What if cancer patients adopt parts of this mindset? With a long-haul mindset, would we handle this better?

Today I was introduced to the Stockdale Paradox (video below) and I immediately saw great relevance to this situation. Admiral Stockdale was the senior Naval POW for over 7 years during the Vietnam War. His life lesson resonated with me. Perhaps it will help you define how you’ll endure this disease. I leave you to discover it as I did.

WBC During Chemotherapy

WBC During Chemotherapy

What happens to WBC during chemotherapy? Standard chemotherapy drugs such as 5-FU, Abraxane, Capecitabine, Docetaxel, Gemcitabine, Irinotecan, Cisplatin, and others disrupt the cell cycle – specifically keeping most cells from dividing. In contrast, targeted therapies act on specific molecular targets present in cancerous tumors.

Examples of rapidly dividing cells affected by standard chemotherapy are blood cells (both red and white), intestinal lining, and taste buds. If you injure yourself, the wounds will not heal until the chemotherapy has left the cells. If you get sick, new white blood cells cannot be created until the chemotherapy has dissipated.

Chemotherapy treatments are spaced spaced in time to allow the body to recover. Unfortunately, the tumor cells go through the same cycle of halted division and recovery. Just like the white blood cells, tumor growth is temporarily halted each cycle.

WBC During Chemotherapy Cycle

WBC During Chemotherapy Cycle

WBC During Chemotherapy Cycle

Below, I’ll describe several stages in a cycle of chemotherapy. These are my own stages for this posting, so don’t try to match them up with some literature.

Chemotherapy treatment

The patient takes the chemotherapy agents (IV infusion or orally).

Cells absorb chemotherapy

After the chemotherapy drug(s) have entered the bloodstream, they are taken up by the cells. All cells – good and bad absorb untargeted chemotherapy. Chemotherapy agents like Gemcitabine and 5-FU disrupt the cell division process by acting like one of the four nucleobases (A, G, C, or T) and preventing the next nucleobase from attaching. This prevents the DNA or RNA from replicating. If the cell does not undergo replication while exposed to these chemotherapy drugs, they are not affected.

Cells division slows/halts

With the chemotherapy agents inside the cell, they can no longer divide and replace themselves. The tumor cannot create more tumor cells – as long as it has not mutated to block the chemotherapy agent from working.

Chemotherapy exhausted

The chemotherapy agents are eventually used up and the cells can resume dividing.

Cells division increases

Cells are still aging and dying, but now the capacity to replace them is catching back up to normal.

Body recovers

The dying cells are all replaced and the division rate of the cells is (almost) back to normal.

WBC Measurements During Chemotherapy

This table describes the sequence and dosage of each of my chemotherapy treatments. The dosages are based upon my body weight/height and changed somewhat from treatment to treatment. I’ll also note that the Cisplatin bag was labelled as light sensitive and covered to keep the room lights off of it. A few times at my local infusion center I had to remind the infusion nurses that the bag should be covered (like the label said).

Gemcitabine/Cisplatin Treatment

TreatmentInfusion TimeDrugDoseType
Bag 1240 minutesPotassium Chloride20 mEqElectrolyte
Magnesium Sulfate9 mEqElectrolyte
Sodium Chloride1000 mL
Bag 260 minutesDexamethasme2.5 mL (10 mg)Steroid
Sodium Chloride50 mL
Bag 330 minutesOndansetron8 mL (16 mg)Anti-nausea
Sodium Chloride50 mL
Bag 460 minutesGemcitabine HCL1074 mgChemotherapy
Sodium Chloride250 mL
Bag 560 minutesCisplatin54 mgChemotherapy
Sodium Chloride250 mL

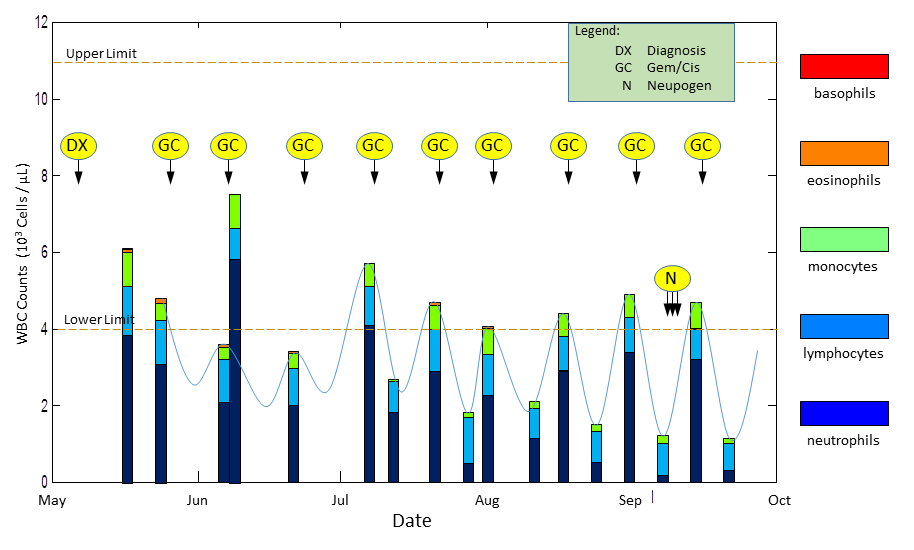
Below are WBC measurements taken during my nine rounds of Gemcitabine/Cisplatin chemotherapy. My treatments were given every two weeks. My initial treatments were at MD Anderson in Houston (a 5-hour drive each way) and soon I opted to have them done locally in Dallas. For the local treatment, WBC was measured during the off-treatment week and these show how the WBC drops and then rebounds.

Towards the end, my neutrophil counts were quite low, and I was given three daily shots of neupogen (480 mg each) to help boost the neutrophil production. These shots gave me bone pains which a hard to describe exactly, but they were indeed pain in the bones (spine, legs) that most closely resembled pain the day after an intense workout. I continued bike riding (which temporarily relieved the pain) and took some aspirin.

WBC Measured During Chemotherapy

WBC Measured During Chemotherapy

One June WBC measurement was made the day after my 2nd chemotherapy infusion. It is the highest of all the measurements and at the time, caused me to think about this WBC cycle and what was going on. I’ve never found any daily WBC measurements made on a patient going through chemotherapy to show what really happens. But at the time of this treatment (2nd of 9 cycles), I still had the capability to make white blood cells and perhaps the body was reacting to the chemotherapy. Or perhaps the steroids or anti-nausea medication had some immediate effect. I’m open to explanations.

Introduction

I was diagnosed with pancreatic cancer on May 11, 2010, after visiting the emergency room because of severe back and abdominal pains. Over the previous five months, those pains doubled in intensity every three weeks and my PCP and various specialists could not find anything except a hiatal hernia. I still have that hernia, but the cancer didn’t make it.

In this blog, I’ll explore pancreatic cancer treatments. The current crop of chemotherapy drugs are blunt instruments that attack all dividing cells. New drugs are being produced that target specific mutations present in many, but not all tumors. As patients, we need to try and select the drugs that present us with the best chance at survival. We don’t have many chances to get it right.

We’ve all heard the dire pancreatic cancer statistics. Every web page and paper written about pancreatic cancer starts with the same bleak outlook. I want to give patients the information they need to increase their odds a fraction. In general, I find that the more knowledge I have about the subject, the less scary it becomes. I have my next treatment steps planned based on my health history and what I know about my genetic makeup.

This information may make no difference, it may make a little difference, or it might give someone their life back.

If you can’t explain it simply, you don’t understand it well enough

Albert Einstein

White Blood Cell Counts

In these next posts, I want to explore the effect that chemotherapy, surgery, and my clinical trial vaccine shots had on my white blood cell counts (WBC). I have every lab test result since contracting pancreatic cancer which I’ll use to illustrate some points.

First, a little bit about white blood cells. White blood cells only live for a few days in the body and must be replenished often. This makes them an unintended target for chemotherapy. Their main function is to fight off infections in the body. When a new infection is found, the white blood cell count rises quickly. Chemotherapy prevents the replenishment of these cells and as the existing ones die off, the counts can plummet.

CBC Panel

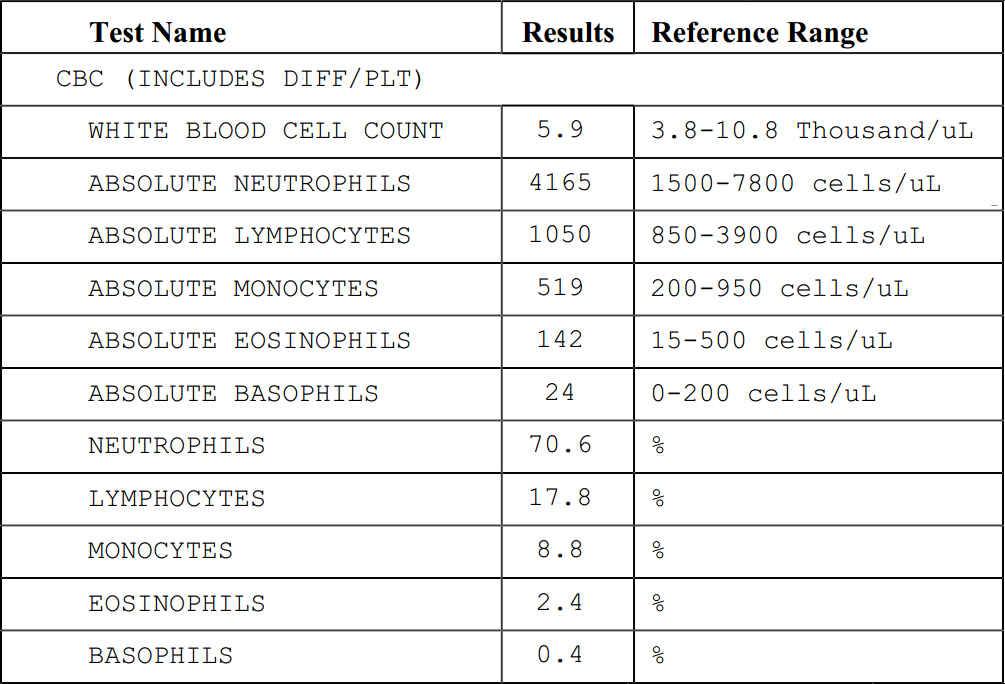
If you’ve had CBC Panel White Blood Cell Countsa blood test, the results will be a part of the CBC (Complete Blood Count) panel. This test measures the number of blood cells in a micro-liter of blood. I’ve extracted the meaningful lines from one of my recent CBC panels here. There is a total count at the top, followed by individual counts of the five types of white blood cells: neutrophils, lymphocytes, monocytes, eosinophils, and basophils.
White blood cells are measured in two different ways. First, there are the absolute counts for each type. A representative sample of the cells can be counted manually, but its likely been done with an automated cell counter that stains and separates the different types before counting them (divided by size and color). The same cell counts are reported as a percentage of the total count. For instance, the neutrophils are 70.6% of the total count of white blood cells (4.165 / 5.9 = 0.706). Doctors will look to see that the relative percentage of these cells is within their expected ranges as well. This particular laboratory does not list ranges for the percentages, but my cancer hospital does.

The Reference Range column shows the range where they’d like the Results to be between. I’ve found that many hospitals have their own ranges that can differ slightly from the others. It seems to show that there are no hard and fast rules about the ranges. The ranges in this example are provided by Quest Diagnostics.

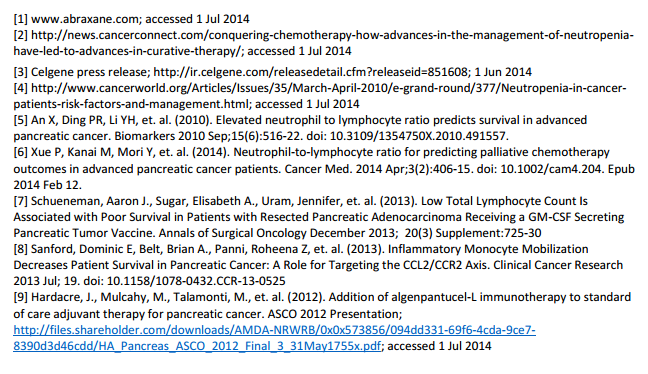
The following table lists published references concerning pancreatic cancer for the various White Blood Cell Counts. In subsequent postings, I will review these in more detail. For now, here is the list and linked references.

Implications of WBC on Pancreatic Cancer

WBC TypePancreatic Cancer Implications
Neutrophils<1500 cells/μL : Halt Abraxane therapy [1]
<500 cells/μL: Halt GAX therapy, resume when >1500 cells/μL [3]
<500 cells/μL + fever -> immediate antibiotics
neutropenia + illness -> febrile neutropenia -> septicemia -> organ failure [2]
febrile neutropenia risk is greatest on first chemo cycle [4]
In advanced PC, NLR>5 predicts shorter survival times [5][6]
LymphocytesGVAX Vaccine, <1500 cells/μL: lower OS, PFS [7]
MonocytesIn resected patients, the monocyte % is related to decreased survival [8]
EosinophilsGemcitabine + 5-FU-XRT + Algenpantucel-L: 70% of patients developed eosinophilia, some lasting up to 2 years [9]

WBC Pancreatic Cancer Implications Sources

WBC/Pancreatic Cancer Implications

Neutrophils

Neutrophils are the infection fighters – the first to arrive at an infection site to ingest bacteria, fungi, or protozoa and when they die en mass they form pus. Neutrophils are the most numerous of all white blood cells, living up to a few days. During chemotherapy, we’re most interested in the neutrophil count. A drop in this count below 1000 cells/µL (neutropenia) may trigger a halt in treatments and/or earn you daily neupogen shots to boost your counts. The drugs Neulasta® and Neupogen® stimulates the bone marrow to produce more neutrophils. A low neutrophil count can cause a minor illness to quickly become major if not enough of these cells are there to eliminate the cause.

Sometimes a blood test result will list the neutrophil count as ANC which stands for Absolute Neutrophil Count.

Neutropenia Grade and Severity

ANC RangeGradeSeverity
0-500cells/μL4Severe
500-1000cells/μL3Moderate
1000-1500cells/μL2Mild
1500-2000cells/μL1
2000-cells/μLN/ANormal

Lymphocytes

Lymphocytes are composed of B, T, and natural killer cells. A subtype of these cells retain a “memory” of previous infections or viruses and attack diseases we’ve previously been exposed to. The vaccine clinical trial I’m enrolled in is trying to train lymphocytes to recognize pancreatic cancer cells, eliminate and retain a memory of them. This article describes how patients with low lymphocyte counts (<1500 cells/μL) receiving the GVAX vaccine are associated with poor survival statistics.

Monocytes

These are the largest of all white blood cells, living up to a few days. About ½ of all monocytes reside in the spleen, unless it has been removed.

An interesting study linking lower monocyte counts to increased survival in resected pancreatic cancer patients is here. The authors divided the resected patients into three groups based on monocyte percentage of all white blood cells (see table) and found that the lower the monocyte percentage, the longer patients survived.

Eosinophils

Eosinophils combat multicellular parasites and are associated with allergies and asthma. These cells may live up to 12 days waiting to fight off bad guys.

Basophils

These are the least common of the white blood cells and are also associated with allergies and asthma. They live a up to a few days.

Wrapping Up White Blood Cell Counts

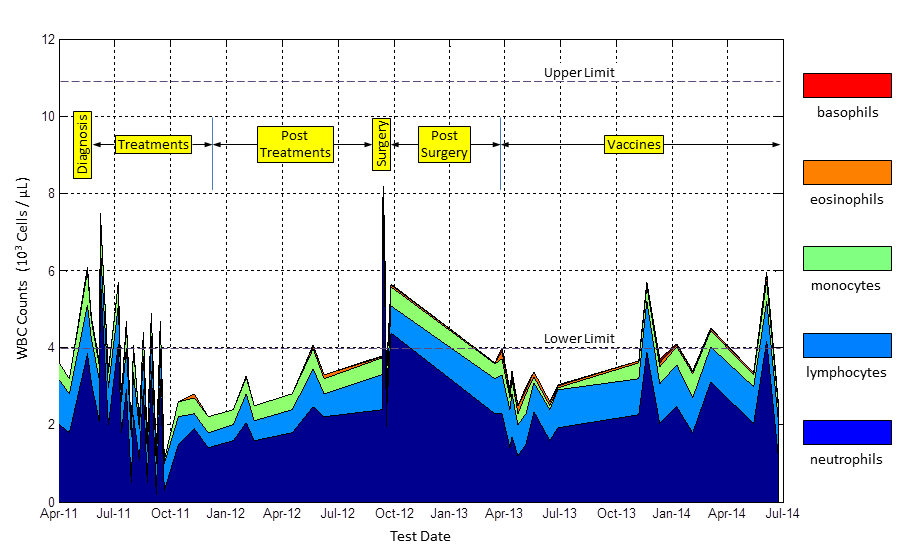
Below I show my white blood cell counts starting just before diagnosis, through chemotherapy, surgery, and finally the vaccine treatments I’m still getting through my clinical trial. The five types of white blood cells are all shown separately and indicated by their own colors. In the next few posts, I’ll zero in on each of these separately to show what went on in more detail.

David Dessert White Blood Cell Counts

You may notice that my white blood cell counts are on the low side. My total WBC “normal” reading is below the 4000 cells/μL lower limit. I’ve found that for some athletes in highly aerobic sports that a lower WBC is normal. I spend around 12 hours for >200 miles on the bicycle each week which I hope is the reason for these low counts. I’ve often been asked if I am feeling well after the doctors get my WBC results. I present this historical record to show that these low readings are normal for me.